
How we manage risk in real estate debt
19 July 2018
After years of strong gains, property prices are stabilising in many locations and declining in some. What impact might this have on Commercial Real Estate Debt as an asset class? This article explains why debt is less sensitive to price movements, and how investors are protected through secured assets.
Making sense of the data
For investors in any asset class, the daily media headlines can cause alarm or elation by turns. There is a tendency for media to highlight information that elicits an emotional response (usually fear or greed), as this drives clicks and sells newspapers.
Even professional analysts may end up with opposing views. On 6 July 2018, one headline in The Australian Financial Review reported, “Risk of ‘credit crunch’ for property investors rising, warns UBS”, while The Australian featured, “Fears of credit crunch ‘overstated’’, according to Macquarie.
However, putting aside headlines, the underlying economic story in Australia is one of sustained economic growth and sound fundamentals.
If we look at the key data released over the April-June 2018 quarter, there were several positive signs: economic growth reached 3.1%, which the Reserve Bank of Australia’s Governor, Phil Lowe, characterised as “a bit stronger than we were expecting”[i].
Business conditions are at their highest in years, and non-mining business investment increased by 10 per cent over the past year[ii].
Sentiment within the property sector remains strong too, with the June 2018 ANZ-Property Council survey finding overall confidence at its highest level on record.
If we look more specifically at residential property prices, we can see the current trends as a pullback, not a crash. As ANZ bank says, “Australia’s housing sector is ‘gliding to a soft landing’.”
Nationally, prices are still 32% higher than they were five years ago, and 9 out of 10 properties are selling at a profit[iii].
And while it’s true that the biggest decline in house prices was in Sydney (0.9% over the quarter or 4.5% over the year), the fall is largely attributable to the upper quartile of property values, which fell by 7.3%. In the lower quartile, prices held steady[iv].
The key point here is that there is no one, single ‘property market’; there is a complex patchwork across each state, city and price point.
History matters – and so do fundamentals
Historically, house price movements have been modest in Australia. The cycle is characterised by a market that self-moderates after a period of strong price growth. For example, since 2003 the house price index hasn’t fallen by more than 6% year-on-year.
With healthy economic and employment growth still the norm, we believe this cycle will show a similar level of moderation.
Rental vacancy rates have been similarly resilient. In Sydney, they haven’t risen above 5% in the past three decades, or above 7% in Melbourne and Brisbane. At the moment, they are very low: 1.4% in Melbourne, 2.5% in Sydney, 2.9% Brisbane.
The biggest driver of this resilience is continued population growth. Melbourne, for example, added over 125,000 residents in 2016-17[v]. If we assume a similar rate going forward, and use the ABS’s average household size of 2.6, we’ll need to build in excess of 240,000 new dwellings over the next five years in Melbourne alone.
Considering the downsides
Qualitas maintains a positive outlook, but we recognise there are headwinds facing the sector too. These include a reduction in foreign buyers; tighter lending criteria for home buyers; and the prospect of higher interest rates if the economy picks up.
Given the strong fundamentals of the market, mentioned earlier, we don’t see such factors driving a property market crash. However, we still identify and mitigate the risks of a market downturn. In fact, we build a significant buffer into each investment, as explained below.
What happens if a borrower defaults on their loan?
All of Qualitas’ loans are secured by real property, at a loan-to-value ratio (LVR) of between 55%-75%. With this in mind, there are several possible scenarios if a borrower can’t repay their loan or service the interest payments.
Take, for example, a $65m loan on property initially valued at $100m property (65% LVR). In the event of a borrower default, we would take possession of the secured property, with the following alternatives.
If property prices remain stable:
- Sell the property for $100m and use that to repay the $65m principal (as well as any outstanding interest); or
- Hold and rent the property, thereby maintaining cashflow for investors in place of interest payments. If the property earns $4m p.a., for example, that equates to a 4% rental yield.
If property prices declined by 35%:
- Sell the property at a market price of $65m to repay the $65m loan; or
- If unable to sell, hold the property and rent (if rents decline as well as property value, the rental income may be lower than the original projected interest, but is still a source of income to investors).
Figure 1: Investing in property debt
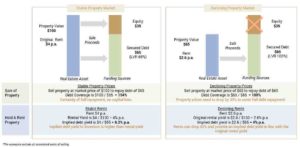
If it’s a construction loan and the project valuation falls during the construction process:
- The loan will be based on the value of pre-sales that have been secured, not the projected value of the completed development, which is up to 40% higher and comprised of unsold stock, equity and the developer’s profit.
- If the value of the property falls by up to 40%, the loan amount can be repaid based on the sale proceeds. If the value falls by 20%, for example, the equity will be covered but the developer will forego their profit.
Qualitas’ track record
These are ‘worst case scenarios’. In the decade since Qualitas began investing, we have not suffered any losses on our investments. A strong risk management framework is applied at all points of our investment process, from deal selection to active management of the asset.
An analysis of projects funded by Qualitas, completed in the last year (to June 2018), reveals that despite some challenges in the residential housing market, our investments have performed well. Moreover, we aren’t seeing indicators of a market-wide malaise.
While there has been evidence of slightly higher than average settlement defaults for some projects, most have settled in line with expectations (defaults below 3%). Where defaults have arisen, the market has been able to absorb this stock within reasonable timeframes varying from 3-9 months. (A 6-month selling period is the appropriate timeframe in a normalised market).
The bank valuations supporting settlements have generally been in line with the contract values, meaning there are no issues with purchasers securing their finance at settlement. And once apartments are leased, it’s within the expected timeframes of a normalised market, i.e. 4-6 weeks on average and within yields of 3.5%-6%.
Our rigorous investment selection, combined with the underlying structure of secured real estate debt, mean that we are able to provide investors with significant protection against any downside risks of the property market.
Disclaimer: This article has been prepared by Qualitas Securities Pty Ltd (ACN 136 451 128) (Qualitas Securities), holder of Australian Financial Services Licence number 342242. Qualitas Securities and its related bodies corporate and affiliates constitute the Qualitas group (Qualitas).
The information contained herein is for informational purposes only and does not constitute an offer to issue or arrange to issue financial products. The information contained herein is not financial product advice. This document has been prepared without taking into account the investment objectives, financial situation or particular needs of any particular person. Before making an investment decision, you should read the publicly available information carefully and consider, with or without the assistance of a financial adviser, whether an investment is appropriate in light of your particular investment needs, objectives and financial circumstances. Past performance is not an indicator of future performance.
No member of Qualitas gives any guarantee or assurance as to the performance or the repayment of capital.
All data in this document has been calculated using the most accurate sources available, however any rates or totals manually calculated may differ from those shown due to rounding. Figures may also differ from those previously disclosed due to adjustments made following period end.
[i] https://www.rba.gov.au/speeches/2018/sp-gov-2018-06-13.html
[ii] https://www.rba.gov.au/speeches/2018/sp-gov-2018-06-13.html
[iii] https://www.corelogic.com.au/news/sydney-and-melbourne-driving-re-sale-profits-over-14-billion#.Wzm9HaczaUk
[iv] https://www.corelogic.com.au/news/sydney-and-melbourne-driving-re-sale-profits-over-14-billion#.Wzm9HaczaUk
[v] http://www.abs.gov.au/ausstats/abs@.nsf/0/B7616AB91C66CDCFCA25827800183B7B?Opendocument